You’re Getting Close Dates All Wrong and Your Company’s Paying the Price. Here’s How to Fix It.
Subscribe to RunRevenue.Pro and get one tip for protecting your revenue — plus updates on new frameworks, playbooks, and exec conversations for running revenue like a pro — delivered straight to your inbox every Friday.

Published: March 1, 2023
Subscribe to RunRevenue.Pro for one game-changing idea for growing your business delivered to your inbox every week. No cold calls or pitches, ever.
The tale of two (slipped) deals.
Let’s start with the first. It was the end of Q2, and we were wrapping up an 8-month sales cycle upgrading a customer from on-premise to cloud. It represented 40% of my annual quota. Our buyer promised a final decision and signature by the end of the month. We were competing unencumbered. It was supposed to be in the bag. I mean, we had everything locked in from an executive sponsor as our champion to clearing every legal and security hurdle.
So, I committed the deal to the business. Put it in commit! SIGNED IN BLOOD.
But on closing week, it got ugly. New players popped up—the CFO and the Chief Procurement Officer—and it turns out they have a mandatory RFP process that was just implemented for spend of this size.
Despite having (seemingly) every single box checked — the deal slipped into Q3. It took them a quarter to build the RFP and another quarter to run it, and while we ultimately won the deal, it didn’t come in until Q1 of the next fiscal year. If you’re counting, that’s three consecutive slips across nine months.
Around the same time in Q2, I was opening another opportunity with this company’s competitor. Thinking that the current cycle took “about 2 quarters,” I set the close date for this one on the last day of Q4. When the first committed deal slipped, I realized that Q4 might be ambitious for this other deal, so I pushed it out a quarter to Q1. Since it was early stage, nobody even noticed (which was also a slip).
As a result, not only did I miss my Q2 number, but I realized in my QBR that I also lowered my total pipeline coverage against my annual number to below 2x, and it was too late to find back-up. Slipping those deals killed my year and made me question if I had what it takes to grow the most important enterprise territory in the company.
Win rates get all the attention when revenue leaders miss their forecasts, but the truth is that slipped deals carry the bulk of the blame.
Here’s real data from a top SaaS company that recently joined Clari’s customer portfolio.
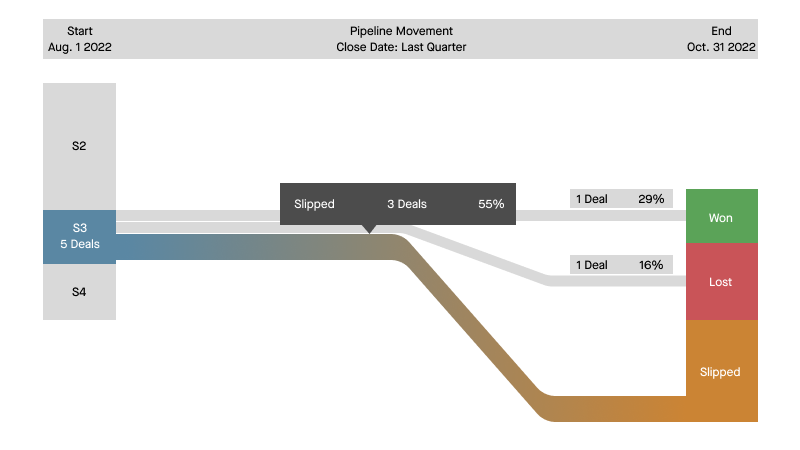
Last quarter, one of their sales teams entered the quarter with 5 deals set to close in quarter in stage 3: “Vendor of Choice” (meaning that the customer had selected them as the vendor they will move forward with). Of those 5 deals, they ended up winning 1 (29%), losing 1 (16%), and slipping 3 (55%).
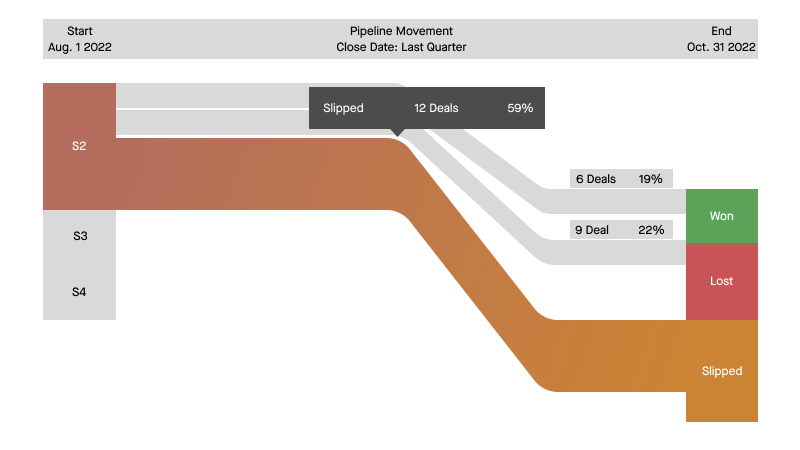
That same team had 27 deals sitting in stage 2 for the quarter. Of those, they won 6 (19%), lost 9 (27%), and slipped 12 (59%).
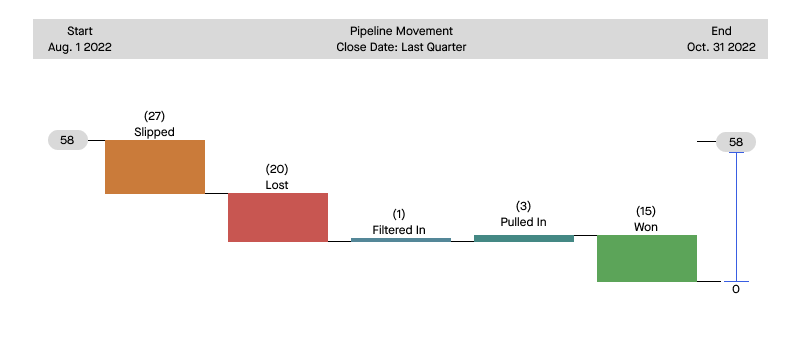
It would be easy to focus on the win rates of 20-30% and say they’re industry average and the team is doing just fine. The reality is that ~ 50% of the 58 deals the sales team signaled were going to close in quarter ended up slipping.
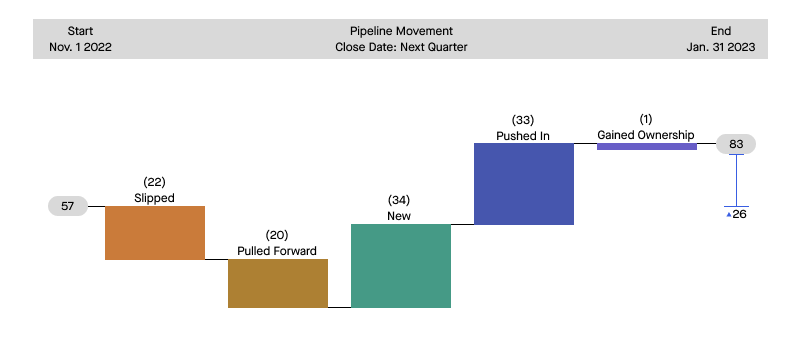
And that’s just the past. The future is more important. That same team came into this quarter with 57 deals in pipe for next quarter (Q1). Halfway through Q4, they now have 83 deals. Yipee! Right? We’re building pipe! The reality is that 33 of those deals slipped in from previous quarters, and 22 of the 57 deals have already slipped out of Q1(likely unnoticed by sales leadership since they’re heads down closing out Q4).
The moral of the story: If you want to control your pipeline and your results, you’ll get the highest return on revenue by focusing on your slip rate, not just win rates.
Read on if you want to uncover:
- The 4 reasons why deals slip
- A formula for measuring your slip rate, plus tips for preventing it
- The mutual action plan template that my team uses in every deal to secure signatures with confidence and accuracy
It’s impossible to completely eliminate deal slippage, but if you follow these steps, you’ll drastically reduce it—closing more revenue on time and injecting precision into your forecast as a result.
What exactly is deal slippage?
Put simply, deal slippage (aka slipped deals) are viable deals that do not close by their set close date and push to a later fiscal period.
Deal slippage: viable deals that do not close by their close date and push to a later fiscal period.
You’ve seen it a million times. Now let’s break down why it happens, so you can prevent it.
4 Reasons why deals SLIP
Close date rigor
Even the best sellers in the world typically set initial close dates based on a combination of gut and intuition. They base it on when they’d hope to see the revenue come in and, believe it or not, user experience of entering the data in internal systems. For example, you open a deal up in Q2, you know it takes about two quarters to close, you set the close date for the last day of Q4 because 12/31/__ is fast to type and easy to change later.
What did I miss in my two deals above? Historical data and facts about the customer’s buying process. Put simply, I was guessing.
Sales stages vs buying stages
Most companies base their deal stages on their selling process, not the buyer’s buying process. This misalignment adds time (and risk) to your deal timeline.
Ineffective pipeline reviews
Lord knows that sales teams spend plenty of time reviewing pipeline. Unfortunately, most of these pipeline reviews aren’t getting leaders the visibility they need, early enough, to spot and mitigate potential deal slippage. The outcome is lots of reporting the news, and not enough strategic coaching.
Blind spots
Slipped deals aren’t bad deals; they’re incomplete deals. Are the reps engaged with the right personas? Do they know the scope of the legal requirements and the time needed to review security? Better yet—can leaders spot this risk across your entire pipeline?
How to measure your slip rate
When calculating slip rates, many revenue teams only narrowly focus on late-stage (i.e. Commit) and current quarter deals. As we’ve seen, that’s a mistake. That’s only one piece of the puzzle. More on that in the next section. First, let’s define the slip rate.
Slip rate is the % of deals, or revenue, that slip from one fiscal period into a later period.
Running revenue comes with a bit of breakage, but if you ignore your slip rate, it will keep plaguing your forecasts quarter after quarter causing frustration and lost credibility with your CEO and the board. Instead, start measuring it.
Here’s how:
To calculate your slip rate, take the total amount (count or revenue) slipped in a period (month/quarter/etc.) and divide that slipped amount by the total amount (count or revenue) initially set to close in that period. Multiply that number by 100 to calculate your slip rate %.

Example:
2 deals slipped / 14 deals in pipeline (*100) = 14.2% slip rate
In this example, if you’re looking at the slip rate for committed deals in the back half of the quarter, a 14% slip rate might be acceptable but not ideal.
In general, if slip rates are 0-5%, you’re probably being too conservative on the deals. However, if you’re slipping over 20% of late-in-quarter committed deals, you likely need to get your house in order—or else you’re going to have some tough internal conversations come end of quarter.
How to prevent your deals from slipping
Slipped deals happen when there is a lack of precision, governance, and collaboration around the four factors outlined above. Here’s how you can establish each quickly.
Ideally, you have a Revenue Platform that allows you to compare past slipped deal behavior to your current and future pipeline make-up so you can adjust close dates, slip mitigation efforts, and forecasts accordingly.
But even if you don’t, here are some tips to lower your slip rate:
- Align your sales process stages with the buyers’ journey as best possible. If your stages are aligned with your internal sales process and not your future customers’ buying stages, you could be at selling stage 4, and they’re still in buying stage 1. Ask the right questions from the beginning, understand the decision pathway, and represent your deal stage appropriately.
- Benchmark against your historical data by determining how long similar deals take to close. For example, if over the last twelve months, your average enterprise deals in North America took 258 days to close, you could build a workflow that automatically sets initial close dates in enterprise at around 275 days.
- Keep a real-time pulse on the deal signals that matter. Leaders should come to pipeline reviews prepared with insights that will actually help spot and mitigate potential slipped deals. Deal activity, relationship health with power, paperwork progress, and number of stakeholders engaged are good signals to start.
Use this template if you want to lower your Slip Rate
As you look to drive behavior change around your revised sales stages and close date rigor, one of the best ways to accelerate this change at scale is by leveraging a mutual action plan to guide reps and future customers through the sales/buying process on every deal.
At Clari, I created a mutual action plan template to help our reps align around the buyer’s journey, ask the tough questions, and constantly pressure test key milestones on the path to signature. Every single rep uses it for every single deal. It’s been a game-changer.
If you’d like access, you’re welcome to adapt this template for your own org.
Be sure to tailor these templates accordingly across your different segments (commercial, enterprise, mid-market, international, industries, etc.), as each will likely have nuances that are slightly unique to their buyers.
One more thing before you go…
During an economic downturn, every drop of revenue matters.
I wish I could tell you that deal slippage is the only revenue leak you need to solve to cruise to quota. But the truth is there are dozens more, and collectively they cause an average of 14.9% of lost revenue every year.
If you want to see what’s causing you to leak revenue, plus proactive advice for stopping it, check out the Revenue Leak Assessment.
Anthony “AC” Cessario
VP of Sales, Industries – Clari